

August Peak Pressure and Labor Cost Risk
August 2026 brings the year's most intense operational test for regional retail managers: back-to-school traffic and summer closeout promotions drive Q3's highest transaction volumes, but demand swings hour by hour in ways corporate labor budgets rarely capture. A Tuesday morning can idle three associates while Thursday evening lines stretch to the door, and the gap between forecast and reality becomes margin erosion. Demand-driven workforce scheduling addresses this volatility by aligning staffing levels to predicted customer traffic patterns rather than historical averages or gut instinct.
The staffing dilemma is familiar but false: overschedule to absorb unpredictable demand spikes and labor cost percentage climbs into the red; underschedule to protect margin and you lose sales, degrade service, and burn out the team you need most. Manual scheduling methods—built from last year's hours and gut instinct—can't adapt to hour-by-hour demand variation, leaving stores either overstaffed during lulls or scrambling during rushes.
Regional managers face corporate pressure to hold four-wall profitability during the industry's most competitive season, but traditional scheduling locks labor decisions days in advance. The solution lies in demand-driven scheduling. Aligning coverage to real transaction patterns.
Demand Forecasting Fundamentals
Demand forecasting is the engine that powers demand-driven workforce scheduling. It combines historical store sales data, day-of-week patterns, promotional calendars, and external events to predict customer traffic hour by hour. The math isn't mysterious: forecasting tools analyze real-time data to predict customer traffic patterns. Examining how many transactions each location processed last August, which days traded heavier, and when promotional events drove spikes. The output is a projected customer count by day and daypart that becomes your labor-scheduling blueprint.
Consider a five-store retail chain preparing for August back-to-school weeks. Historical data shows Saturday traffic outpaces Monday during promotional periods, with the heaviest volume between 11 a.m. and 3 p.m. A demand forecast captures this pattern and allows the scheduler to staff Saturdays proportionally heavier and Mondays leaner. Without the forecast, managers schedule by habit or gut feel, often overstaffing slow days and understaffing rushes.
Forecast accuracy drives the labor cost reduction documented in case studies: when you schedule to predicted demand rather than guesswork, you eliminate the waste built into defensive scheduling. August 2026 back-to-school events and summer clearance sales create predictable demand spikes that forecasting captures, turning seasonal volatility into a planning advantage.
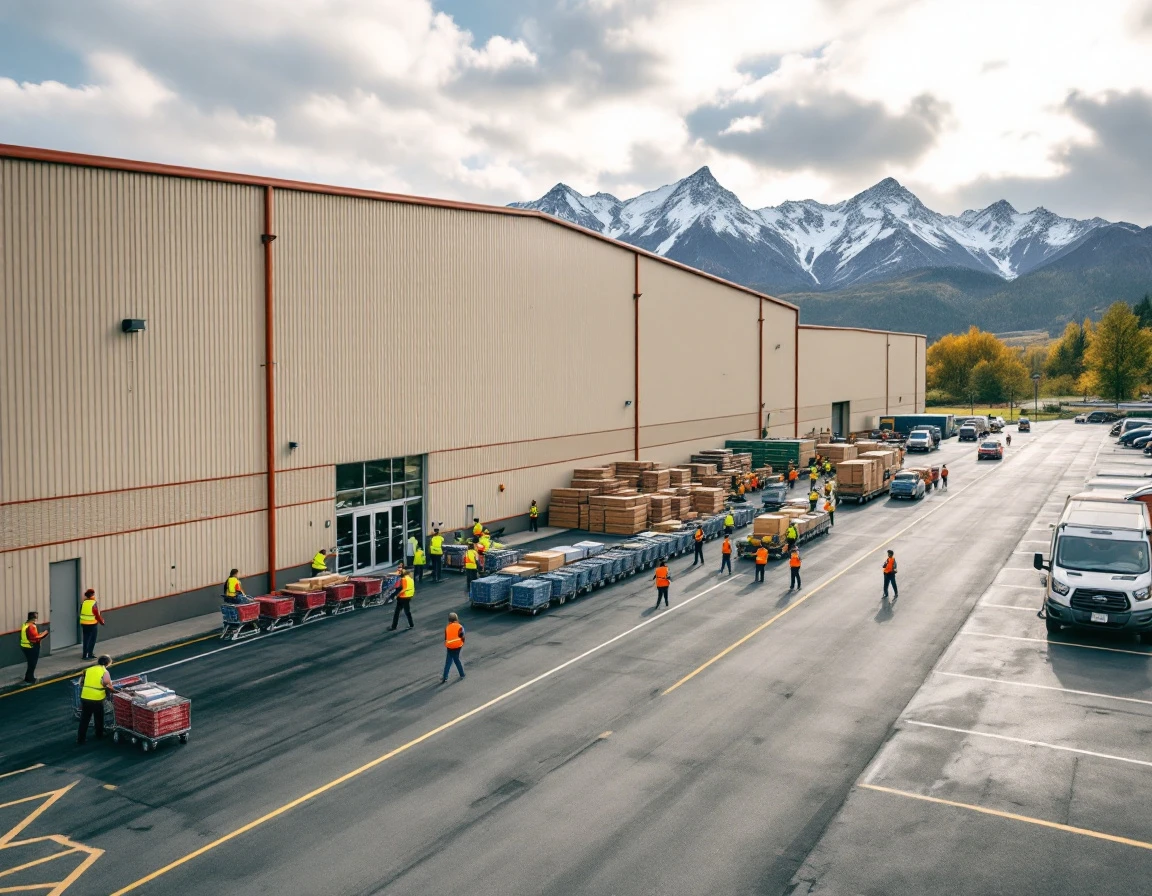
Labor Scheduling Software and Workforce Optimization for Retail Stores
Once you have a demand forecast by hour and location, software becomes the bridge between prediction and the actual schedule. The right platform takes four inputs — forecast demand, labor compliance rules, staff availability, and your labor cost targets — and builds schedules that respect all constraints at once. Platforms that lack forecast input capability treat scheduling as a reactive exercise: you publish a schedule, then adjust when reality hits. That approach will not deliver the labor cost improvement or service consistency promised by demand-driven workforce scheduling.
Regional managers running five to fifty stores need software that collapses scheduling work from hours to minutes and scales across all locations. Evaluate platforms on these capabilities:
- Forecast integration
- Real-time adjustment when demand shifts
- Mobile access for staff
- Automated compliance enforcement for break rules and hour caps
- Multi-location support
Demand-driven scheduling uses demand forecasts, transaction volumes, workforce availability, and compliance rules to create best coverage. Start with a two-week trial at a single store. Measure labor cost reduction and service metrics — average transaction wait time, checkout line length — then expand to all locations by early August.
August deployment requires four to six weeks: setup, staff training, and parallel-run testing before peak demand arrives. Software selection is the implementation step that makes demand-driven workforce scheduling operational.

Implementation Timeline and August Setup
Missing August peak season means missing the year's most important profitability window. The work starts in July — before the traffic arrives — with a clear four-week roadmap that turns demand forecasts into live schedules.
- Weeks 1–2 (July): Conduct a labor efficiency audit at every location. Calculate your current labor cost percentage of sales and identify which hours are overstaffed or understaffed. Benchmark baseline metrics — average transaction wait time, sales-per-labor-hour, coverage gaps during afternoon rushes — so you have a before state to measure against.
- Weeks 3–4 (July): Deploy your chosen platform and run parallel schedules, comparing old manual rosters against demand-driven plans. Validate forecast accuracy against actual customer traffic and tune your models before August traffic arrives.
- Early August: Go live across all locations. During the first back-to-school week, track labor cost percentage, transaction wait time, and SPLH daily. A manager who waits until August to start will miss the savings window entirely.
ROI Metrics and Cost Savings Verification
Measure your labor improvements the way corporate evaluates them: labor cost as a percentage of sales. This metric normalizes performance across store sizes and makes your results reportable upward. Track it against your pre-implementation baseline — typical retail runs 8-12% — and measure again after your August back-to-school weeks.
Three metrics tell the story. Labor cost percentage captures the four-wall P&L impact. Sales per labor hour reveals efficiency gains. Service metrics — transaction wait time, customers per labor hour, checkout line length during peak periods — prove you improved coverage, not just cut hours.
A 20-store retail chain running 10.5% labor cost hit 9.2% after August implementation, a 1.3-point improvement worth $340K annually. Demand forecasting and automated scheduling help eliminate costly overtime and prevent overstaffing during low-demand periods. Your software investment pays back when labor cost reduction exceeds the platform cost within your first peak season — stores averaging 10-15% improvement recoup their spend in three to four months.

Next Steps: August Ready Action Plan
You've built the case for demand-driven workforce scheduling and identified the metrics that tie labor spend to four-wall margin. The operators who protect profitability this August are the ones moving from understanding to implementation now, weeks before the back-to-school rush peaks.
Start with a PlannerPuffin demo configured for your store count and August demand scenario. Bring your historical sales data and promotional calendar so you can see how forecasts translate into coverage plans for your busiest Saturday.
Next, audit your current July-August labor costs and service levels to establish a baseline. Document labor cost as a percentage of sales, SPLH by location and daypart, and any coverage gaps or customer wait-time complaints. This baseline becomes your ROI benchmark.
Finally, align your operations team and store managers on a go-live date in early August and set shared ROI targets. Define monitoring cadence—daily tracking the first week, then weekly—so everyone owns the outcome. Retail managers use workforce optimization to reduce labor costs and improve scheduling. August peak is weeks away. The managers who implement now gain the margin advantage while competitors scramble with last year's spreadsheets.