

Summer Traffic Exposes Coverage Gaps
Most retailers plan summer staffing by station scheduling — allocating headcount against forecasted sales volume station by station, then distributing those hours across the week. The store looks adequately staffed on the schedule grid, labor cost percentage stays within budget, and the plan clears finance review. But the schedule that works on paper unravels the moment customers arrive unevenly across stations.
June through August drive foot traffic peaks that hit registers, fitting rooms, and service desks simultaneously. A store might staff six registers but schedule only two cashiers during a Saturday afternoon rush. Three fitting rooms share one attendant who's also covering returns. The floor has adequate total headcount, but no one is positioned where the bottleneck forms. Customers wait, abandon purchases, or leave without trying on merchandise, and the team absorbs the operational stress of being in the wrong place when demand spikes.
This isn't a staffing shortage problem — it's an allocation problem. The hours exist in the labor budget; they're simply not deployed to the stations where summer traffic concentrates. Workstation-based scheduling closes these gaps by matching coverage to the specific demand patterns each role experiences, keeping both service levels and labor costs predictable.
Station-Based Coverage Audit Framework
The first step in a station-level staffing audit is mapping your store's summer workflow around four core stations: the register, the sales floor, fitting rooms, and the service desk. During peak summer traffic — typically late morning through early evening on weekends and during sale events — each station plays a distinct role. Registers process transactions and upsells. The sales floor handles browsing customers, product questions, and visual restocking. Fitting rooms manage try-ons and returns-to-rack. The service desk handles returns, exchanges, and order pickups. When any one station runs short, the entire customer flow stalls.
Start your audit by counting current staff allocation per station during your busiest summer hours. Then measure station-specific demand signals: average transaction time at the register, fitting room turnover rate (how many customers cycle through per hour), and floor coverage ratio (square feet per associate). Record wait times and customer complaints by station over a two-week period. These metrics expose where the gaps live. A store might staff twelve people on a Saturday afternoon but assign only one to fitting rooms with ten active rooms — a bottleneck that no amount of total headcount will fix.
Next, calculate minimum coverage thresholds for each station based on your demand data. A useful starting benchmark: fitting rooms need one attendant per five active rooms, registers need enough lanes open to keep wait times under three minutes, and the sales floor requires one associate per defined zone during peak traffic. Compare your current allocation against these thresholds to run a coverage gap analysis scheduling review. If your fitting rooms need two people but you schedule one, you've found your coverage gap.
This audit becomes the foundation for station-specific scheduling. Once you know which stations run short and by how much, you can reallocate hours without adding total headcount. For deeper insights into how forecast accuracy drives better allocation decisions. See our Forecast Accuracy Tracking post.
Calculating Minimum Staffing per Station
Registers require a baseline formula: divide peak-hour customer count by the number of customers one cashier can serve per hour, then add one for coverage. If average transaction time is three minutes, one cashier processes twenty customers per hour. A twelve-register store averaging four hundred peak-hour customers needs twenty cashiers' worth of throughput — but you'll schedule five to six because registers rarely run at full capacity and breaks need coverage.
Fitting rooms follow a simpler ratio. One attendant can manage four to six active rooms during summer traffic, processing returns, restocking, and maintaining flow. A store with sixteen rooms peaks at twelve to fourteen occupied during Saturday afternoon, requiring two to three dedicated attendants rather than expecting floor staff to cover both zones.
Service desk staffing ties directly to interaction volume. One person handles fifty to eighty customer interactions per hour — returns, exchanges, pickups, inquiries. Count last summer's hourly transaction logs at the desk, identify your peak windows, and staff one person per seventy-five interactions as your baseline. Most retailers discover they've been running one person during windows that generate a hundred and twenty interactions, creating the backup everyone dreads.
June–August Peak Timing Guidance
Summer traffic doesn't arrive in a single wave. Early June brings leisure shoppers and weekend browsers while weekday traffic remains light. By mid-June, back-to-school shoppers begin their research phase, lifting midweek foot traffic and extending average transaction times as families compare options. July swings between vacation-driven weekend spikes and quieter weekday mornings, then accelerates in the final ten days as back-to-school urgency builds. Late July into August delivers the season's highest sustained traffic, with both weekday and weekend volume climbing above June baselines by twenty to thirty percent across most retail categories.
These seasonal staffing peak times demand station coverage that matches intensity, not static headcount. Week one of June might require baseline register coverage — two cashiers during peak hours — while week three of July needs four, plus a roving team member to manage line flow. Fitting rooms follow the same curve: early June tolerates one attendant per shift, but late July requires continuous coverage with backup during two-to-six p.m. rushes. Sales Per Labor Hour Optimization shows how aligning station staffing to these curves protects both service speed and labor efficiency, preventing the common trap of uniform coverage that overstaffs slow weeks and understaffs peaks.
The practical timeline starts in early May. Finalize your June–August labor budget and station-level targets by mid-May, then begin seasonal recruiting by the last week of May to allow two weeks of onboarding before June traffic arrives. Cross-train existing staff on backup stations — registers, fitting rooms, floor — during the first week of June while volume is manageable. Adjust weekly schedules every Sunday based on the prior week's transaction data and the coming week's position on the summer curve, adding fitting room and register hours incrementally as you move from early June into the July-August peak.

Building and Testing Station Schedules
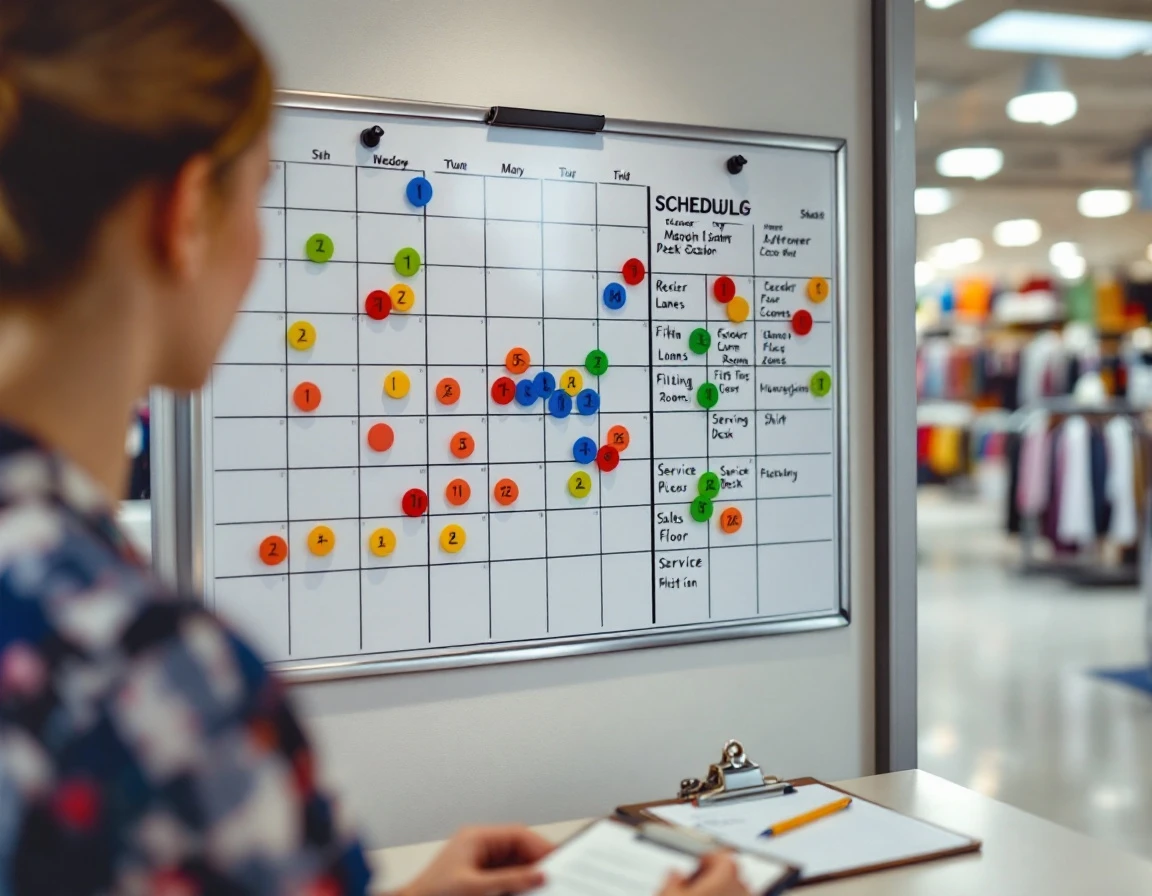
The shift from audit to schedule happens station by station. Instead of assigning three people to "cashier" or two to "floor," a retail scheduling by workstation approach allocates by station for every shift: two on register, one in fitting rooms, one roaming floor, one at the service desk. This explicit allocation makes coverage gaps visible before the shift starts — a manager scanning the schedule sees immediately whether each station is staffed during peak hours, rather than discovering the fitting room is unmanned when the customer line forms.
Rotating coverage prevents burnout and builds cross-training flexibility. If the same person works fitting rooms every Saturday in July, fatigue sets in and call-outs spike. Rotating assignments across stations — registers Monday, floor Wednesday, service desk Friday — spreads the cognitive load and prepares the team to cover for absences. Cross-training also protects the schedule when someone calls out: if three people can work the service desk, losing one doesn't collapse coverage.
Test the schedule for one to two weeks in early June before the late July peak arrives. Measure wait times at each station, track call-out impact, and adjust assignments based on what breaks. A pre-launch checklist helps validate the plan: all stations covered during peak hours, no single-person stations without backup, and a documented call-out protocol that names who covers which station when someone is absent. This testing window turns assumptions into operational proof before the highest-traffic weeks demand flawless execution.
See how PlannerPuffin's schedule builder assigns staff by station and flags coverage gaps before the shift starts.
Station-Coverage Checklist for Summer
This checklist is the tool that moves staffing by station scheduling from concept to practice. Update it weekly through June, July, and August to catch coverage drift before it shows up in wait times or customer complaints.
Pre-Summer Preparation (Complete by Late May)
- Audit current staffing by station, not just total headcount — where are your people actually assigned during peak hours?
- Set minimum coverage thresholds for each station using the formulas from your audit.
- Schedule a test week in early June to validate assignments under real traffic.
- Train backup coverage so at least two people can work each high-traffic station.
Weekly Monitoring During Peak Season
- Track wait times per station every Monday morning — measure register queues, fitting room hold times, and service desk response intervals.
- Log call-outs by station to identify patterns that leave specific areas chronically short.
- Capture customer feedback tied to physical areas, not generic complaints — fitting room waits and checkout speed matter more than overall satisfaction scores.
Red Flags That Require Schedule Adjustments
Register lines consistently over five minutes signal under-coverage, not slow cashiers. Fitting room waits over ten minutes mean you need another attendant during that daypart. Service desk response time slipping from two minutes to five indicates allocation failure. When any red flag appears two weeks in a row, adjust the following week's schedule before the gap becomes permanent.
This checklist ties directly to your four-wall P&L — coverage gaps cost sales, and over-staffing low-demand stations wastes labor dollars. Request a demo to see how scheduling software turns this checklist into automated alerts and station-level coverage reports.